
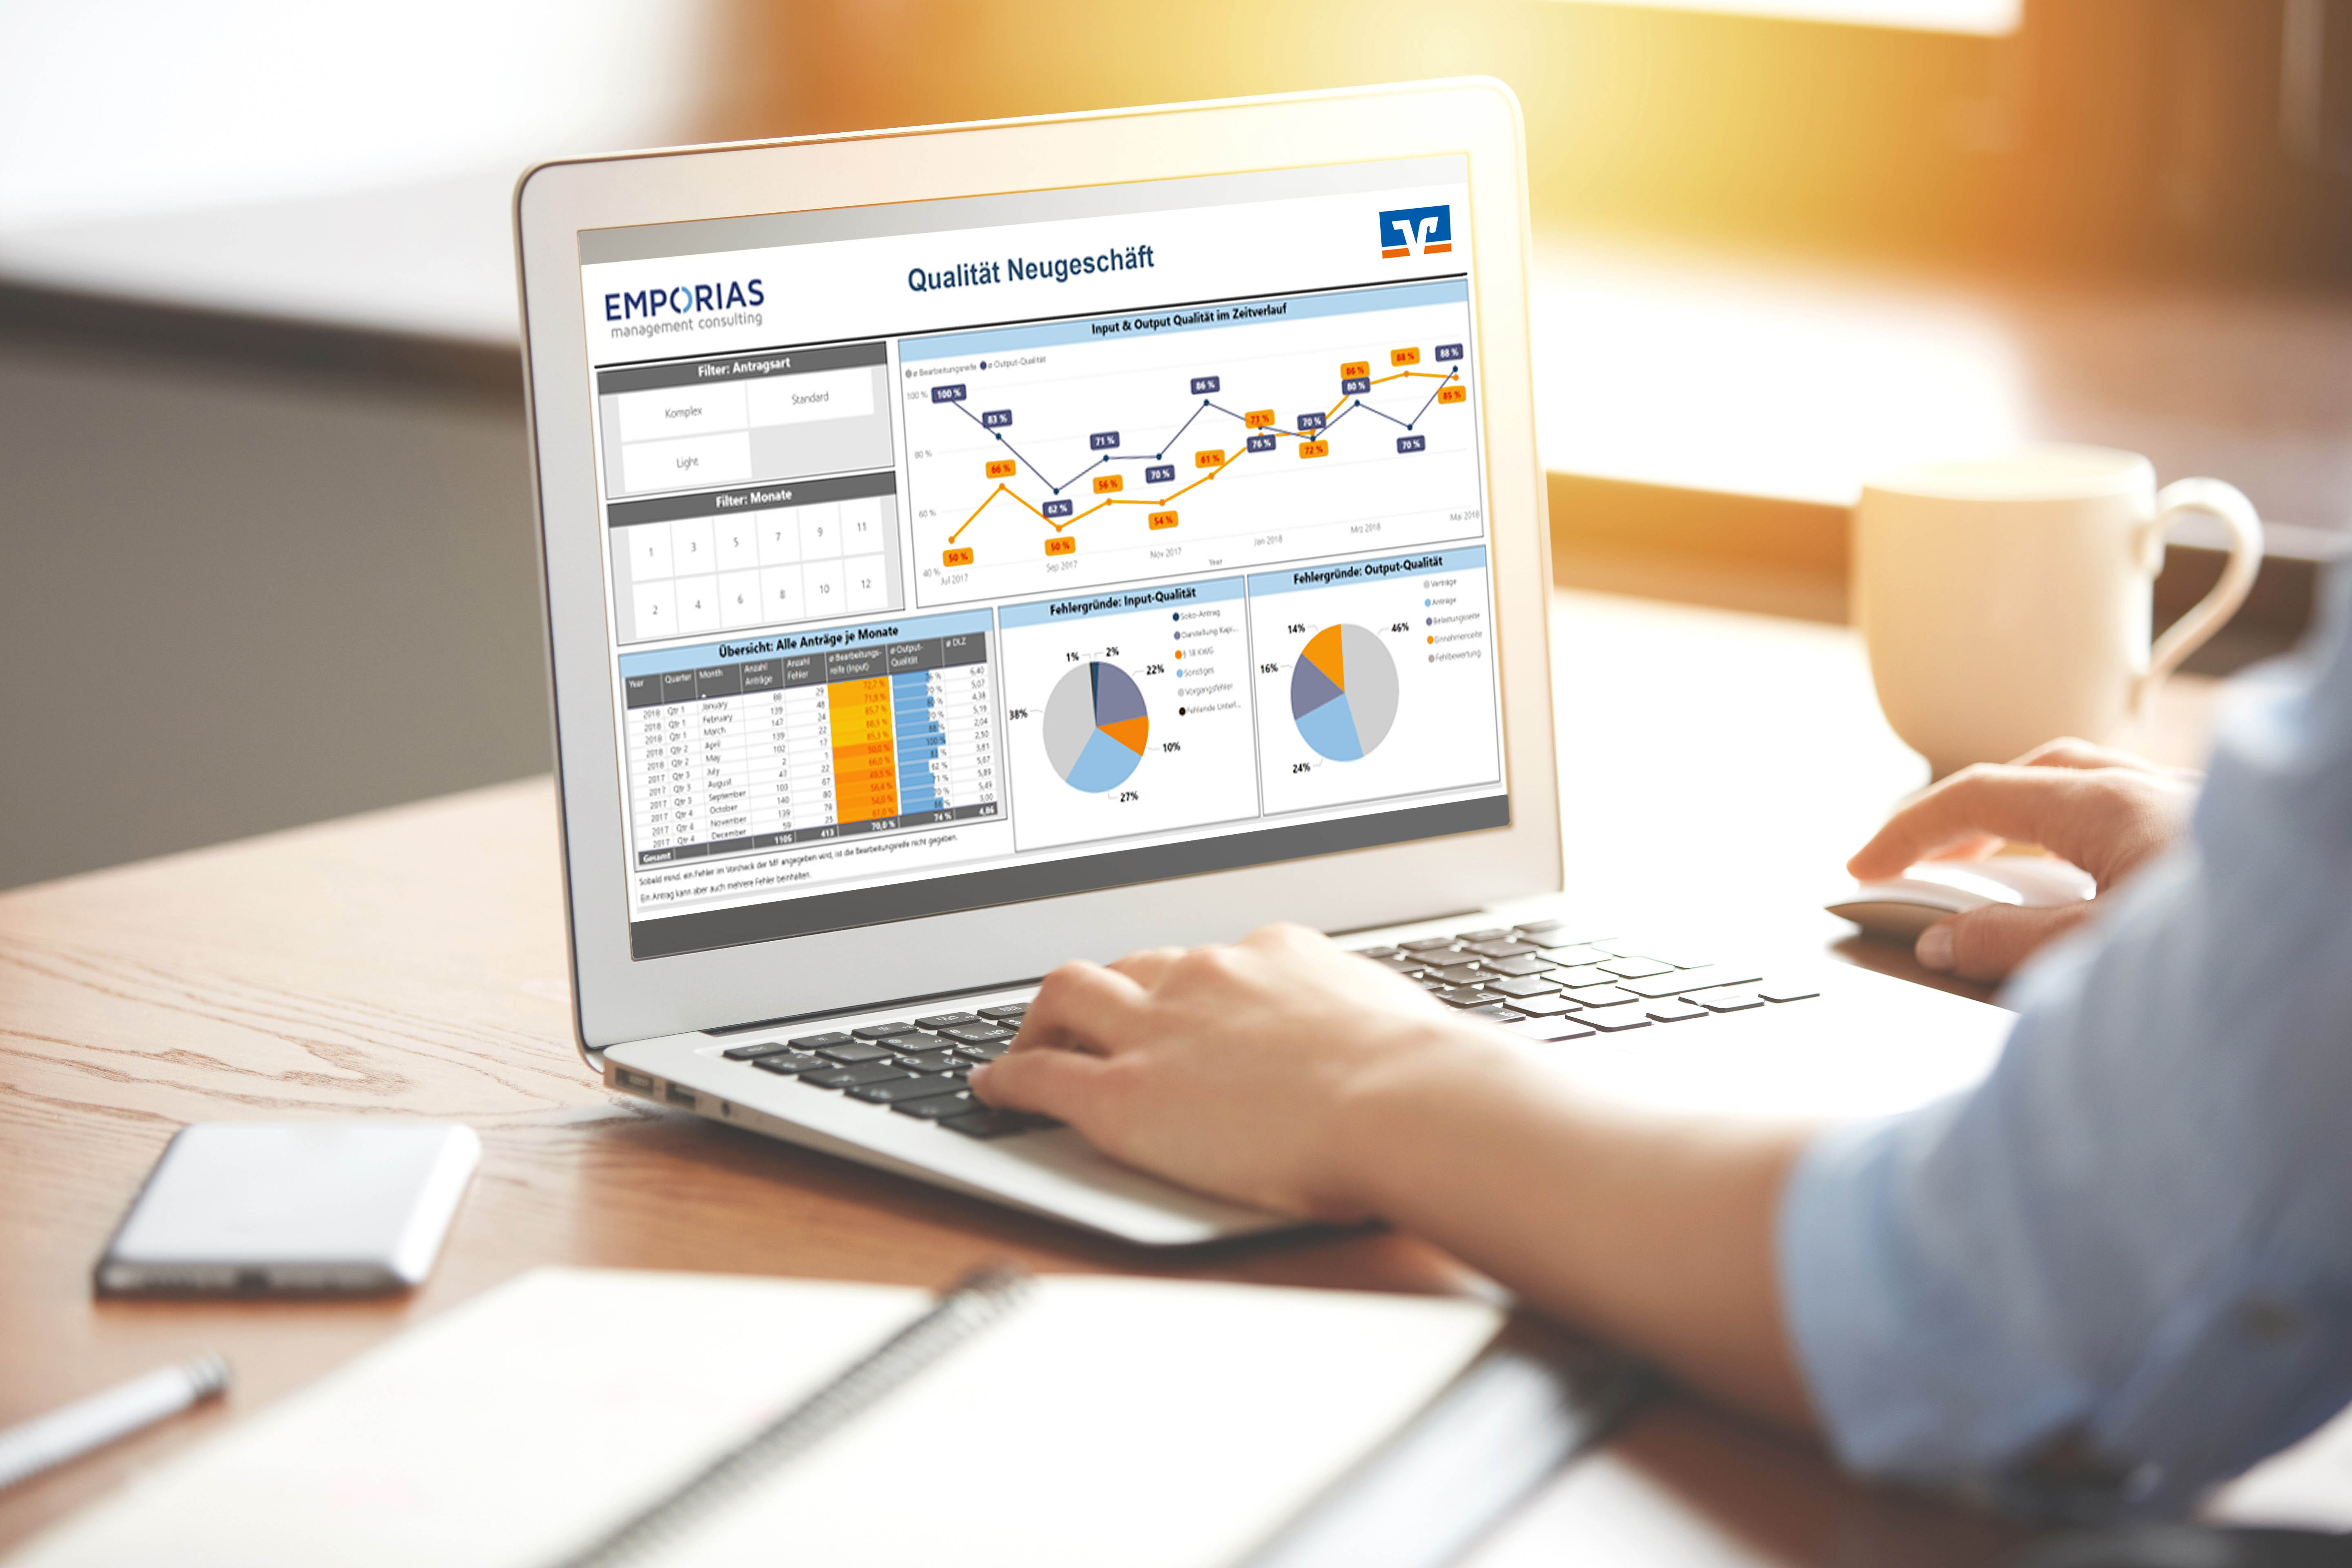
A key performance indicator (KPI) dashboard provides financial service providers with the transparency needed to effectively manage complex value creation and audit processes. It consolidates key KPIs from sales, risk, compliance, and operations, making performance and regulatory requirements measurable. Through the structured presentation of all relevant data, decision-makers gain a clear overview of trends, deviations, and areas requiring action. The KPI dashboard thus not only supports secure, compliant management but also identifies opportunities for optimization throughout the entire process chain. In this way, it becomes a central management tool for increasing efficiency, reducing risks, and sustainably improving the quality of services.
To increase transparency in their lending processes, KPI dashboards have been implemented at various VR banks. By establishing measurable productivity metrics, the banks were also able to create a data foundation for an objective and effective continuous improvement process (CIP).

Define key metrics
What are the right metrics?
1. Why use key performance indicators?
2. Which ones are relevant?
3. Where are the measurements taken?
Implement cockpit
How do I get the right metrics?
1. Check data sources
2. New data collection, if necessary
3. Structure & Visualization
Working with key metrics
What should I do with the right metrics?
1. Interpreting & Controlling the Cockpit
2. Support continuous improvement
20 years of experience in the field of key performance indicators
Solutions for all relevant core banking systems and workflow applications used by savings banks, Volks- und Raiffeisenbanken, and insurance companies (OS Plus, agree BAP, Credo, KPM ventuno, SAP)

45+ custom-configured dashboard dashboards with BI solutions
Comprehensive implementation support, from jointly defining key performance indicators through to implementation and working with the KPI dashboard